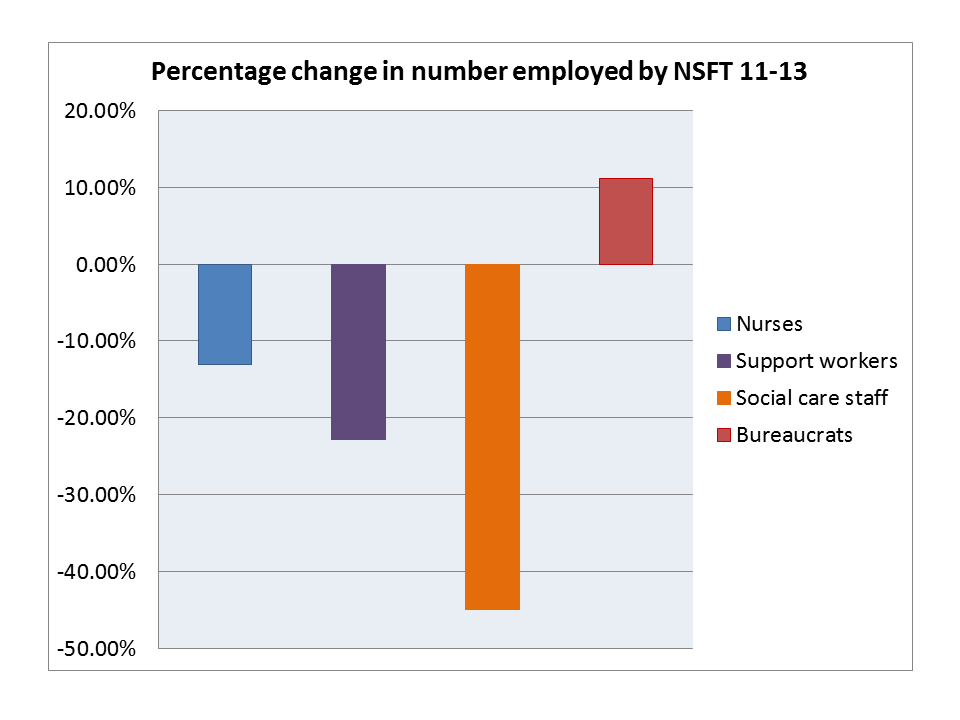
Sometimes a graph just says it all. Sources are the Norfolk & Suffolk NHS Foundation Trust Annual Report & Accounts 2012 and 2013. Figures are the percentage changes in mean number of whole time equivalent (WTE) staff employed in the listed categories during the financial years ending 2011 and 2013.